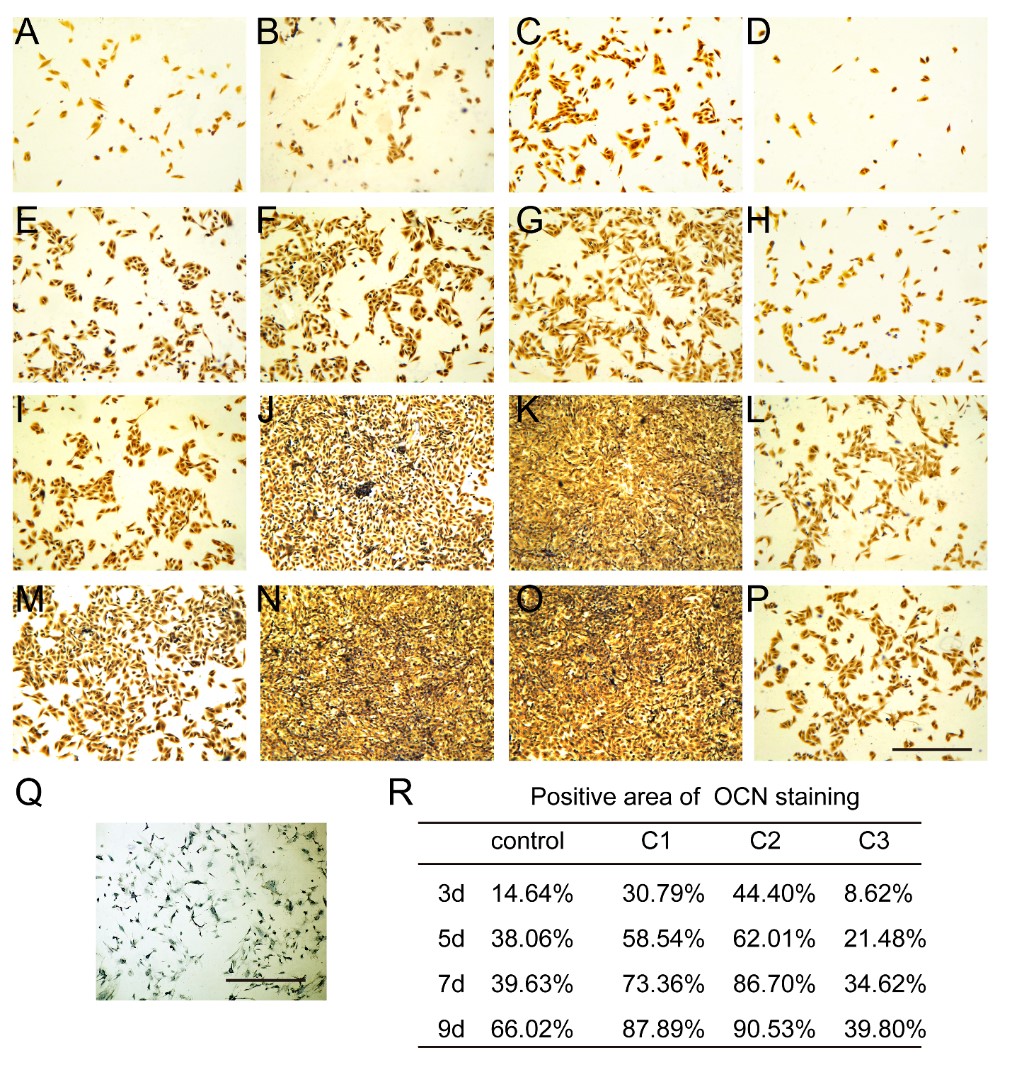
Fig. 5. (A-D, E-H, I-L, M-P) OCN staining of osteoblasts at various concentrations (0µM, 4.46µM, 8.92µM, and 17.84 µM) of AP on day 3,5,7,9, respectively. Negative control staining was presented in Fig.Q, the positive rate was showed in Fig.R. The scale bar is 1000µm.